The Word file and the PDF carry the whole guide. The student pages are the two checkpoints and the culminating task, one to a sheet.
About this unit
The unit starts where a mark stands for one thing. Bears are sorted into a six-row graph, one bear to a box, and a row is long for exactly one reason: it holds many bears. Then a chart of X's is built from a list and checked back against it, which matters because two pages of the book give the walking trail different counts — so the chart becomes a thing that can be wrong and tested rather than a picture.
The middle of the unit is the key. Four vote counts of forty, thirty, twenty and ten are drawn at one figure for every ten votes, and the graph is handed to another pair who have to recover all four counts from the rows and the written sentence alone — if a number comes back wrong, the sentence gets fixed, not the answer. Then children survey their own class and meet the problem the book never has to face: a class-sized survey rarely divides by ten. They test keys of one, two, five and ten against all four of their counts, cross out any key that leaves half a figure in any row, keep the largest one still standing, and say which count knocked the bigger ones out. The next lesson reads the graph back for arithmetic: both directions of two comparisons, all four counts added to one hundred, and a front-page position defended with two counts inside the sentence.
The last three lessons change the display and keep the question. In a circle graph the yellow half does not stand for one child or for ten pieces — it stands for ten children, and the size of a piece means nothing until the whole is known. Children fill a quartered circle with twenty cubes, then answer four questions somebody else asked about a finished graph, one of which has no winner because two pieces are equal and one of which wants a fraction rather than a count. The unit ends with them building a circle graph from their own class, with the two things the book insists on: a title saying what the graph is about and a label on every piece.
The mathematical arc
Each lesson does one job the lesson before it made possible.
A row is long because it holds many, and for no other reason
A chart can be checked against the list it came from
One figure for ten votes, and a sentence that says so
Choose a key that every one of your counts can live with
Read the counts back out of the rows and do the arithmetic
A piece means nothing until you know the whole
Answer somebody else's questions, and say what kind of answer it is
Build one of your own that a stranger can read
Source books
Every lesson in this unit is already published under Math lessons. Nothing here asks you to teach anything you cannot open today.
Each day names one lesson that already exists under Math lessons, with its book, its number and its title. This guide says what that lesson is doing in the sequence and what to collect from it; the lesson itself carries the steps, the printables and the answers.
Thirty minutes a day.
Five minutes to connect to yesterday, the twenty-minute source lesson, five minutes to close on something you can see. A day that runs long should lose the close, never the core.
Teach a lesson on its own if you need to.
Every day carries a one-sentence opening for a teacher who is using that lesson outside the sequence.
Stop after a checkpoint.
The unit holds together if you stop after either checkpoint and come back to it. Stopping between a checkpoint and the next one leaves a lesson without the evidence it was built on.
Where this fits in your year
When to teach it
After children can tally and read a one-to-one graph. It is a good unit to run alongside anything that produces class data.
What students need first
Children can tally and count tallies by fives, count by tens, and recognise a half and a quarter of a circle.
What this unit develops
Reading length as count; checking a chart against the list it came from; drawing a scaled pictograph and writing its key; testing candidate keys against every count in the data; recovering counts from rows and a key; comparing and totalling from a graph; what one piece of a circle graph stands for; answering somebody else's questions about a finished graph; titling and labelling a graph of your own.
What it prepares them for
Grade 4 work with scaled axes and line graphs, and any later task where a display has to be chosen and defended as well as read.
Curriculum connections
None claimed. The lessons in this unit carry their own standards classifications on their own pages, checked lesson by lesson. A unit-level expectation is a different claim, and none has been verified for this unit, so none is printed here. Use the placement guide above to site the unit in your year, and the individual lesson pages for the codes.
Unit at a glance
#
Mathematical move
Source lesson
Collect
1
A row is long because it holds many, and for no other reason
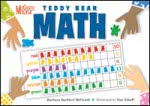
Teddy Bear Math lesson 1, Build the Six-Row Bear Graph
A six-row graph built from the child's own tub with all six counts written, then checked against the six the book prints.
2
A chart can be checked against the list it came from
The Runaway Puppy lesson 4, A Column of X's
A chart built from the list by the book's method, with every column counted and checked back against the list one entry at a time.
3
One figure for ten votes, and a sentence that says so
Ask Mia lesson 1, Four Rows, One Figure for Ten Votes
A four-row pictograph at one figure to ten votes, with the whole graph's votes counted by tens and checked against one hundred.
4
Choose a key that every one of your counts can live with Checkpoint after this lesson
Ask Mia lesson 4, Ask Our Class
Four counts from the class with the total reconciled, a key-testing card with the failed keys crossed out, and four rows drawn at the surviving key.
5
Read the counts back out of the rows and do the arithmetic
Ask Mia lesson 3, Thirty More Votes Than Advice
Four counts recovered and checked, both directions of two comparisons written, and the four counts added to one hundred.
6
A piece means nothing until you know the whole
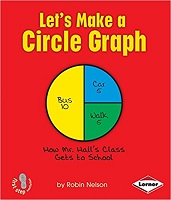
Let's Make a Circle Graph lesson 1, One Piece, Ten Children
A quartered circle with all three pieces filled and labelled with counts, and both facts said aloud about every piece.
7
Answer somebody else's questions, and say what kind of answer it is Checkpoint after this lesson
Let's Make a Circle Graph lesson 2, Reading the Circle Back
Four answers with the compared pieces named, the no-winner question identified, and the fraction answer given as a fraction and then as a count.
8
Build one of your own that a stranger can read
Let's Make a Circle Graph lesson 3, Build the Circle from Your Own Class
A coloured circle graph of the class with a title and a label on every piece, and a note on the back about any count that does not fit a half or a quarter.
Unit vocabulary
Words students say, not words they are taught to define.
key
The sentence saying what one figure stands for. Without it the rows are decoration.
scaled
One mark standing for more than one thing. Lesson 3 is where the graphs stop being one to one.
survey
Asking every person the same question the same way. Lessons 4 and 8 run one on the class.
whole
Everybody the graph is about. A circle graph piece cannot be read until the whole is known, which is lesson 6.
title, label
What a graph needs before a stranger can read it. Lesson 8 will not accept a graph without both.
equally likely
What two categories with the same count get called. It turns up in lesson 7 as the question with no winner.
Materials
From the source lessons
Each day's materials are listed on that day's page below and on the source lesson itself. Nothing is duplicated here.
New for this unit
Checkpoint 1 page, one per child
Checkpoint 2 page, one per child
Performance task set: a card carrying four counts that do not divide by ten, a key-testing card listing 1, 2, 5 and 10, graph paper ruled in ten squares across, a sentence strip for the key, a quartered paper circle, twenty cubes and a pencil, one set per pair
Performance task page, one per child
Assessment plan
Daily evidence
Keep the key-testing card from lesson 4 with the crossed-out keys on it. It is the only page in the unit that shows the arithmetic behind a key: a child who crossed out ten and five and can say which count did it has understood the lesson, and a card with nothing crossed out means the keys were never tested against all four counts.
Checkpoint 1, after lesson 4: Which key will work?
Four counts — 12, 8, 6 and 10 — a key-testing card and graph paper. The child tests each candidate key against all four counts, chooses the largest that leaves no half figures, draws the rows and writes the key.
Book-free. A card of four counts, graph paper and a pencil, no book.
Look for. Two crossed out and two chosen out loud: ten and five both fail because of the counts that are not multiples of them, and the child should be able to name the count that knocked each one out.
Checkpoint 2, after lesson 7: Read somebody else's graph
A finished pictograph with a key of five and a finished circle graph of a class of twenty, with four questions the child did not write. The child answers each and says whether the answer is a category, a count or a fraction.
Book-free. Two finished graphs and four printed questions, no book.
Look for. The count recovered by counting on in fives rather than by counting figures, and the fraction answer given as a fraction before it is given as a count. Watch for a child who answers the question with no winner by picking one anyway.
Culminating task: Four counts, two displays, and a stranger who has to read them
Each pair is given four counts that do not divide by ten. They test keys of one, two, five and ten against all four, cross out the ones that leave half a figure, keep the largest still standing, and draw the pictograph with its key written underneath. They then show the same data a second way: they take the count of the whole, lay twenty cubes into a quartered circle to test whether their categories fall on halves and quarters, colour what does fit and write on the back what does not, and add a title and a label on every piece. Last they hand both graphs to another pair, who must recover all four counts from the rows and the sentence alone, and they fix whichever of the two is at fault when a number comes back wrong.
Collect. The key-testing card with the crossed-out keys, the pictograph with its written key, the circle graph with a title and a label on every piece, the note on the back about any count that would not fit a quarter, and a record of what the other pair read back.
What it assesses. One set of data displayed two ways, with the key chosen by testing rather than by preference, and both graphs proved readable by somebody who was not there — which is the only test of a key that matters.
Daily lesson pages
Lesson 1A row is long because it holds many, and for no other reason
Skill lessonTeddy Bear Math · lesson 1, Build the Six-Row Bear Graph · Grade 3 · 20 minutes Building a one-to-one bar graph from sorted objects and reading length as count
I can
I can build a graph one object to a box and read a row as a count.
Big idea
On a one-to-one graph the length of a row is the count. Nothing else makes a row long, and that is why the graph can be read at a glance.
Success
The child sorts the tub, lays one bear in each box of the right row, writes the number at the end of every row, and reads all six counts before meeting the book's printed numbers.
Connect | 5 min
First lesson. Tip out a tub of coloured bears and ask which colour there are most of. Take the guesses, then sort them into rows.
Taught on its own
The book says to sort a pile of coloured bears, lay one bear in each box of a labelled row and write the number at the end of every row — and then prints all six numbers.
Source core | 20 min
Children sort their own tub by colour, lay exactly one bear in each box of its labelled row with no gaps, and write the count at the end of each of the six rows before anybody opens the book to the printed answers.
Collect
A six-row graph built from the child's own tub with all six counts written, then checked against the six the book prints.
Close | 5 min
Children lay the longest row and the shortest row alongside each other box for box, count the boxes that stick out past the short one, and say what that number is — a question the book asks and never answers.
From the source lesson: A tub of coloured bear counters per group of four, holding red, yellow, purple, blue, orange and green; A sorting mat per group, a plain sheet of paper large enough to keep six sets apart; A six-row grid per group, rows labelled red, yellow, purple, blue, orange and green, with square boxes the width of one bear and at least fifteen boxes to a row; A pencil per child; A card per group carrying the book's line of six row numbers, printed face down; A strip of card per group, long enough to lay along a whole row; Word cards: row, most, least
Watch for: Bears squeezed two to a box or spread with gaps. Either one breaks the only thing making the row readable; rebuild the row rather than adjusting the count.
Lesson 2A chart can be checked against the list it came from
Skill lessonThe Runaway Puppy · lesson 4, A Column of X's · Grade 3 · 20 minutes Building a bar chart of counts by the book's own method and reading the tallest column
I can
I can build a chart from a list and check it back against the list.
Big idea
A chart is a claim about a list, so it can be wrong. Checking it against the list is part of making it, and when two sources disagree the disagreement has to be reported rather than smoothed over.
Success
The child builds the chart by the book's own method, reads the tallest column, and finds and states the count that the book's two pages disagree about.
Connect | 5 min
Yesterday one bear made one box. Today one X makes one visit, and the list is long enough that somebody will lose count.
Taught on its own
A child in the book teaches another how to make a bar chart in two sentences: the places go along the bottom, and an X goes above a place for every time it was visited.
Source core | 20 min
Children write the places along the bottom, work down the list marking one X above the right place for every entry, then count each column and read the tallest.
Collect
A chart built from the list by the book's method, with every column counted and checked back against the list one entry at a time.
Close | 5 min
Two of the book's pages give the walking trail a different count. Children find both, say which one their own chart agrees with, and say what they would need in order to settle it.
From the source lesson: Squared paper per pair; A list of thirteen visits per pair, in the order they happened; A pencil; The two conflicting sentences, enlarged; Word cards: column, bottom, tallest, chart
Watch for: A column counted without going back to the list. The check is the lesson; have the list read aloud while a partner touches each X.
Lesson 3One figure for ten votes, and a sentence that says so
Skill lessonAsk Mia · lesson 1, Four Rows, One Figure for Ten Votes · Grade 3 · 20 minutes Making a scaled pictograph with a key of ten
I can
I can draw a graph where one figure stands for ten, and write the key.
Big idea
As soon as one mark stands for more than one thing, the graph needs a sentence saying how much. Without it the rows cannot be turned back into counts by anybody.
Success
The child draws one figure for every ten votes across all four rows, writes the key underneath, and hands the graph to a pair who recover all four counts from the rows and the sentence alone.
Connect | 5 min
The bear graph needed one box per bear. Ask what a graph would look like for forty votes, and let somebody start drawing forty of anything.
Taught on its own
The book hands over one line of results — forty, thirty, twenty and ten votes across four columns — and one line telling how a pictograph shrinks.
Source core | 20 min
Children write the four counts in order off the results line, count forty by tens raising a finger on each number word, and draw one stick figure for each finger raised, one figure per square, stopping when the fingers stop — then do the same for the other three rows, lining each row up under the one above.
Collect
A four-row pictograph at one figure to ten votes, with the whole graph's votes counted by tens and checked against one hundred.
Close | 5 min
Children write the key sentence at the bottom and read it to a pair who have not seen the graph, then let that pair use it to say how many votes each row holds — and if a wrong number comes back, fix the sentence rather than the answer.
From the source lesson: Survey strip with the four column names; Pencils; Graph paper ruled in ten squares across; Sentence strip for the key; Word cards: key, pictograph
Watch for: A figure drawn across two squares. It reads as two, and the read-back is where it shows up.
Lesson 4Choose a key that every one of your counts can live with
Skill lessonAsk Mia · lesson 4, Ask Our Class · Grade 3 · 20 minutes Collecting survey data and choosing a workable key
I can
I can survey my class and choose the largest key that leaves no half figures.
Big idea
A key is not a preference. It has to divide every count in the data, so choosing one means testing candidates against all of them and keeping the largest that survives.
Success
The child surveys the class, tests keys of one, two, five and ten against all four counts, keeps the largest that leaves no half figure, and says which count knocked the bigger ones out.
Connect | 5 min
Yesterday every count was a multiple of ten. Ask whether a class of twenty-seven will be that obliging, and go and find out.
Taught on its own
In the story the kids ask around, tally what they hear, and only then draw.
Source core | 20 min
Children take the four columns to every person in the room marking exactly one tally each and saying the four choices the same way every time, count each tally group by fives, add the four numbers and check the total against the number of people asked — a total too big means somebody was marked twice.
Collect
Four counts from the class with the total reconciled, a key-testing card with the failed keys crossed out, and four rows drawn at the surviving key.
Close | 5 min
Children write their key sentence, hand the graph to another pair to read all four counts back, and when a number comes back wrong work out whether the row or the sentence is at fault.
From the source lesson: Tally sheet with the four column names; Pencils; Key-testing card listing 1, 2, 5 and 10; Graph paper ruled in ten squares across; Sentence strip for the key; Word cards: key, pictograph, survey
Watch for: A key chosen because it makes short rows. Ask for the count that rules out the next key up; if there is none, the key is not the largest.
Checkpoint after this lesson: Which key will work?. The page is at the end of this guide.
Lesson 5Read the counts back out of the rows and do the arithmetic
Skill lessonAsk Mia · lesson 3, Thirty More Votes Than Advice · Grade 3 · 20 minutes Comparing categories and totalling a pictograph
I can
I can turn rows back into counts and say both directions of a comparison.
Big idea
A graph is worth having because it answers questions. Every answer starts by turning rows back into counts with the key, and a comparison is one fact that can be said two ways.
Success
The child recovers all four counts using the key, writes both directions of two comparisons, adds the four counts to one hundred, and defends a front-page choice with two counts inside the sentence.
Connect | 5 min
Two graphs have been built and read back by strangers. Today the reading back is yours, and it has arithmetic in it.
Taught on its own
The results line sets four counts against each other and the characters start arguing at once: one column takes the front page, one is waved off with the word only.
Source core | 20 min
Children use the key to turn each row of figures back into votes — counting the figures first and then counting by tens — and write the four numbers without looking back at the results line, then lay two rows directly under each other and count the figures that stick out past the shorter one.
Collect
Four counts recovered and checked, both directions of two comparisons written, and the four counts added to one hundred.
Close | 5 min
Children say which column they would print on the front page with at least two counts in the sentence, answer a partner who must also use counts, and finish by saying how many of the hundred did not pick their column.
From the source lesson: A pictograph of the survey with four rows and a key; Pencils; Comparison sentence strips; Word cards: fewer, more
Watch for: A total that misses one hundred. Recount the row the pair is least sure of and find where the votes went, rather than adjusting the total.
Lesson 6A piece means nothing until you know the whole
Skill lessonLet's Make a Circle Graph · lesson 1, One Piece, Ten Children · Grade 3 · 20 minutes Finding how many children one piece of a circle graph stands for
I can
I can say both things about a piece of a circle graph: what fraction it is and how many children that is.
Big idea
On a circle graph a piece stands for a share of everybody. The yellow half is not one child and not ten pieces — it is ten children, and only the size of the class makes that true.
Success
The child fills the circle's pieces with cubes to match the stated counts, writes the count in each piece, and says for each piece both what fraction of the circle it is and how many children that is.
Connect | 5 min
Every graph so far has had rows. Show a circle cut into a half and two quarters and ask how many children the half stands for. Take the answers, then count the cubes.
Taught on its own
The book states the class size, the count of bus riders and the fraction in three separate sentences and leaves the reader to put them together.
Source core | 20 min
Children count twenty cubes into the paper circle and say what one cube stands for, move cubes into the yellow half until it holds the bus riders' count, fill the blue and green quarters from what is left, and write the count in each piece.
Collect
A quartered circle with all three pieces filled and labelled with counts, and both facts said aloud about every piece.
Close | 5 min
Children find one half and one fourth of three other class sizes and write both counts for each, then say which class size makes a quarter that cannot be shared out evenly.
From the source lesson: Twenty cubes and a mat per pair; A large paper circle per pair, marked into quarters; A pencil; Three paper labels per pair: bus, car, walk; A three-row class-size sheet per pair; Word cards: whole, half, fourth, class
Watch for: The piece read as a number of pieces rather than of children. Ask what one cube stands for and have the sentence said again.
Lesson 7Answer somebody else's questions, and say what kind of answer it is
Skill lessonLet's Make a Circle Graph · lesson 2, Reading the Circle Back · Grade 3 · 20 minutes Answering questions about a circle graph, including one whose answer is a fraction rather than a count
I can
I can answer questions about a finished graph and say whether my answer is a category, a count or a fraction.
Big idea
A graph gets read for other people's questions, and the questions are not all of one kind. Some want a name, some want a number, and one may have no single answer at all.
Success
The child answers all four questions naming the pieces compared, identifies the question with no winner, gives the fraction answer both ways, and sorts the four answers by kind.
Connect | 5 min
Yesterday the pieces got counted. Today somebody else's four questions arrive, and one of them cannot be answered the way it is asked.
Taught on its own
The book asks four questions about its own graph and answers none of them.
Source core | 20 min
Children answer the three category questions from the graph and write beside each answer which pieces they compared, then find the one that asks which of two answers more children gave and write the honest answer, because on this graph neither did.
Collect
Four answers with the compared pieces named, the no-winner question identified, and the fraction answer given as a fraction and then as a count.
Close | 5 min
Children write beside each of their four answers whether it is a category, a count or a fraction, and say which question was the odd one out and why.
From the source lesson: A finished circle graph per pair, coloured and labelled; The four questions, enlarged; A four-row answer sheet per pair; A pencil; Word cards: most, more, equal, how much, how many
Watch for: A winner picked for the question that has none. Ask for the two counts and let the equality stand.
Checkpoint after this lesson: Read somebody else's graph. The page is at the end of this guide.
Lesson 8Build one of your own that a stranger can read
Skill lessonLet's Make a Circle Graph · lesson 3, Build the Circle from Your Own Class · Grade 3 · 20 minutes Building a circle graph from a survey of the class, with a title and labels
I can
I can survey my class, build a circle graph, and give it a title and labels.
Big idea
A graph is finished when somebody who was not in the room can read it. That takes a title saying what it is about and a label on every piece, and it takes honesty about a count that does not fit a quarter.
Success
The child tallies a three-answer survey, checks the total against the class, colours the pieces, writes a title and a label on every piece, and has another pair read the graph back.
Connect | 5 min
The circle graph has been counted and read. Today the class makes one of its own, and it has to survive being handed to strangers.
Taught on its own
The book shows the whole procedure in six short sentences: ask a question, collect the answers, count the class, draw a circle, colour the pieces, and put on a title and labels.
Source core | 20 min
Children agree one question with three possible answers, ask every child in the class marking a tally as each answer is given, add the three counts and compare the total with the number of children — finding what was missed before anything is drawn.
Collect
A coloured circle graph of the class with a title and a label on every piece, and a note on the back about any count that does not fit a half or a quarter.
Close | 5 min
Children hand the graph to another pair to read back to them, and where a count does not fit a half or a quarter they say so on the back rather than forcing the piece to fit.
From the source lesson: A tally sheet per pair, ruled for three answers; A pencil; A large paper circle marked into quarters, per pair; Coloured pencils per pair; Word cards: survey, data, title, label
Watch for: A count forced into a quarter to make the circle tidy. The note on the back is the better answer, and it is worth praising out loud.
Culminating performance task
Four counts, two displays, and a stranger who has to read them
Each pair is given four counts that do not divide by ten. They test keys of one, two, five and ten against all four, cross out the ones that leave half a figure, keep the largest still standing, and draw the pictograph with its key written underneath. They then show the same data a second way: they take the count of the whole, lay twenty cubes into a quartered circle to test whether their categories fall on halves and quarters, colour what does fit and write on the back what does not, and add a title and a label on every piece. Last they hand both graphs to another pair, who must recover all four counts from the rows and the sentence alone, and they fix whichever of the two is at fault when a number comes back wrong.
Collect. The key-testing card with the crossed-out keys, the pictograph with its written key, the circle graph with a title and a label on every piece, the note on the back about any count that would not fit a quarter, and a record of what the other pair read back.
What it assesses. One set of data displayed two ways, with the key chosen by testing rather than by preference, and both graphs proved readable by somebody who was not there — which is the only test of a key that matters.
Teacher key and rubric
Key
Checkpoint 1: a key of two. Ten and five are both ruled out — five by the twelve, the eight and the six, and ten by all four except the ten itself. A key of one works but is not the largest, and children should say so.
Checkpoint 2: choose the questions yourself, and include one where two categories are equal so there is honestly no winner, and one asking what part of the class rather than how many.
Task: pick four counts totalling twenty so that the circle graph is actually possible — 10, 5, 3 and 2 gives a half, a quarter and two pieces that do not fit a quarter, which is the interesting case. The note on the back is the point, not a failure.
Rubric
Strand
Secure looks like
Developing
Not yet
Representation
Figures sit one to a square in lined-up rows, every piece of a circle graph is labelled, and the graph carries a title and a key without being asked.
Does it with the arrangement in front of them.
Produces an answer without the arrangement or the reason.
Calculation
Counts are recovered from rows by counting on in the key rather than by counting figures, the four counts add to the number of people asked, and a candidate key is tested against every count.
Does it with the arrangement in front of them.
Produces an answer without the arrangement or the reason.
Meaning
A mark is described as standing for a stated number of things, and a piece of a circle graph is read only against the whole. A key that leaves half figures is rejected with the count that ruled it out.
Does it with the arrangement in front of them.
Produces an answer without the arrangement or the reason.
Explanation
A comparison from a graph is said with the number in it and in both directions, and a claim about which category wins carries at least two counts.
Does it with the arrangement in front of them.
Produces an answer without the arrangement or the reason.
Print-ready student pages
These three pages print one to a sheet. Everything above them is the teacher guide.
Checkpoint 1 · Grade 3
Which key will work?
NameDate
Which key can you use for these four counts? Try them all. Tell me which count rules out each key you crossed off, then draw your rows and write your key underneath.
Checkpoint 2 · Grade 3
Read somebody else's graph
NameDate
Answer these four using the graphs. For each one, tell me whether your answer is a category, a count or a fraction. Is there a question here you cannot answer with a single winner?
Culminating task · Grade 3
Four counts, two displays, and a stranger who has to read them
NameDate
Here are four counts. Test every key against all four and keep the largest one that gives whole figures, then draw your rows and write the key. Now show the same data as a circle graph: check with the cubes whether your categories land on halves and quarters, colour what fits and write on the back what does not, and put on a title and a label for every piece. Then swap with another pair and see whether they can get your four counts back.
Teacher planning and handoff
The habit worth keeping is the read-back. Hand a graph to someone who was not there and see whether the counts come out; it catches a missing key, a squeezed figure and an unlabelled piece in one go.
Watch for counts recovered by counting figures instead of counting on in the key — four figures reported as four votes. It passes unnoticed while the key is ten and becomes invisible when the key is two.
Ask Mia has three further lessons this unit could not take: finding the total number of figures by reading the funding sentence first, writing a letter that must carry two counts and a difference, and cutting two rows loose to say the gap both ways. Any of them is a good extra day, and the letter is the best writing task in the material.
The Runaway Puppy's likelihood lesson — most, least and equally likely attached to four counts — was left out because it is about the words rather than the display. It fits better beside probability work, and the phrase equally likely turns up in lesson 7 anyway.
Known gaps in this unit
A numbered scale on an axis. The pictograph scales by a key, the bar charts are one to one and the circle graph works in halves and quarters, but no candidate puts a scale counting by twos or fives up the side of a bar graph — which is the form children meet most often next year.
Choosing the display. Lesson 4 chooses a key and lesson 8 is told to make a circle graph; nothing asks a child to decide which display suits the question and defend it, so the performance task makes them show one set of data twice instead.